War—what is it good for? Absolutely nothing — When President Trump announced late on June 21 that he had ordered the bombing of Iranian nuclear facilities, many people feared the decision could begin a spiral into a wider war. However, just two days later, Trump proclaimed a ceasefire deal between Israel and Iran that he promised would end “the 12 day war”—a reference to a period that commenced with Israel’s first bombing of Iran 10 days prior, followed by repeated counter attacks from both countries, including an Iranian missile strike on Al Udeid Air Base in Qatar, the largest U.S. military facility in the Middle East and home to thousands of American troops.
Though the ceasefire remains fragile, it is still holding. In fact, when it looked like the ceasefire might be broken, Trump profanely berated both Iran and Israel and urged both sides, particularly Israel, to scale back retaliatory strikes.
The situation will, of course, remain very delicate. Iran is likely to maintain both its hostility to Israel’s existence and its desire to build a nuclear weapons program. Meanwhile, Trump’s quick pivot may indicate that his strategy is to use military force as a tool to get a better deal (i.e., a quick ceasefire in this case), rather than as a first salvo in a long war as Israel’s protector. We hope so.
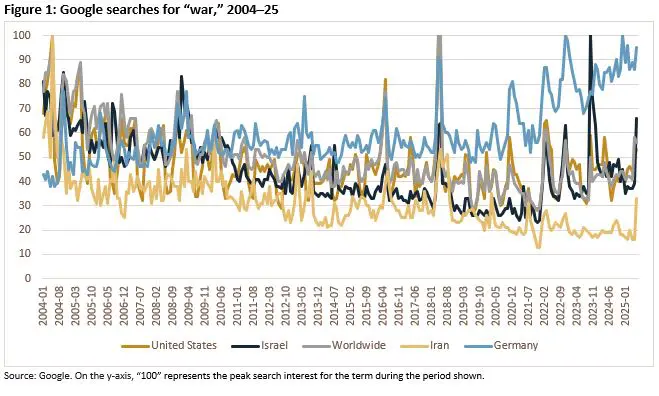
Google searches for “war” are on the rise globally but have hit only about 50% of the search engine’s all-time high (Figure 1). The 2018 high was set during the rhetorical skirmish between North Korea and the U.S., during Trump’s first term. (Elton John’s track “Rocket Man” would have made a fine Talking Points header during this period.) While the prospect for another big war in the Middle East seems to be creeping into the minds of people everywhere, the reaction from financial markets has been much more muted.
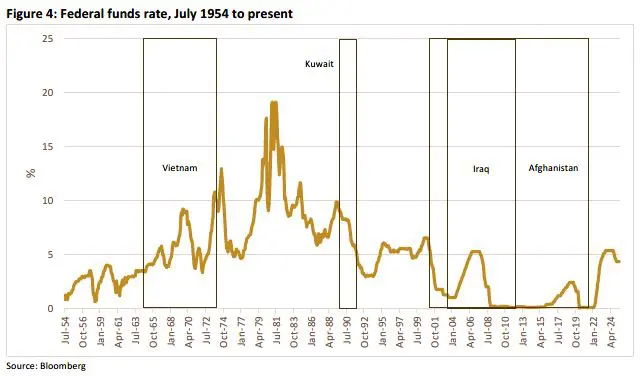
Media outlets will be sure to cover the Israel-Iran headlines and keep them in front of us in the weeks to come. Yet from a market perspective, Edwin Starr may have had the right idea when he sang, in 1970, that war is good for absolutely nothing. Figures 2 through 6, below, summarize how U.S. debt and equity markets performed during recent American wars. Treasury rates, for example, declined in three of the past four wars that Uncle Sam was involved in.

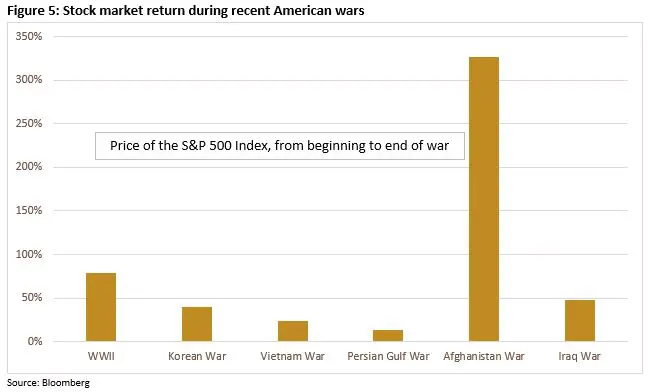
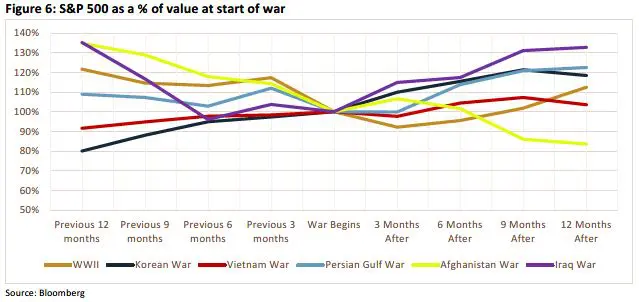
As a fixed-income company, we try to not make a habit of commenting on equity markets. But, as Figure 5 shows, stock prices have been extremely resilient during wartime.
From the charts, one can see that interest rates are largely determined by monetary policy, not by wars themselves. For example, Federal Reserve Chair Jerome Powell mentioned the Israel-Iran conflict in his post-Federal Open Market Committee press conference on June 18. Specifically, he referenced the possibility of higher oil and natural gas prices and the potential inflationary impact of rising transportation and input costs (oil is a component of many products, such as plastics). The price of West Texas Intermediate (WTI) crude rose by around 23%—from nearly $61/barrel on May 30 to $75/barrel on June 18. Higher energy prices sustained over a long period, Powell noted, would be factored into the Fed’s projection of inflationary pressures and resulting monetary-policy decisions.
For now, however, the conflict appears to be cooling off and neighboring Middle East countries appear content to remain on the sidelines. Oil prices have dropped (WTI closed near $65/barrel on Friday) and investor fears have calmed.
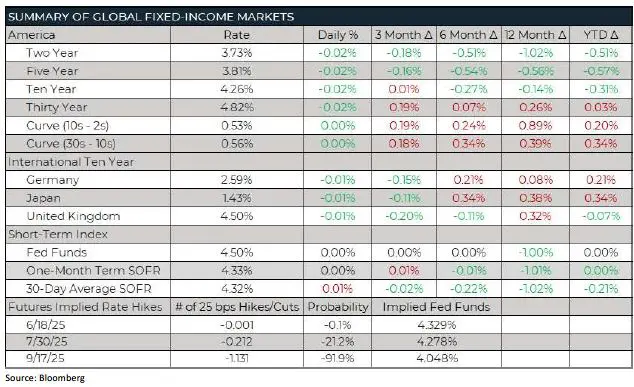
Last week was also constructive for the Treasury market, with a downward trend in yields reflective of growing demand. Treasury yields approached recent lows for most tenors going back to the first week of May: 10-year yields broke below the 200-day moving average of 4.31% on Wednesday and continued trending down, touching a weekly low of 4.24% on Thursday and Friday. Fading risk of escalation in the Middle East was clearly one factor driving yields lower. More dovish Fedspeak—together with a rising likelihood that this year’s U.S. fiscal package won’t fulfill the worst deficit fears—also likely boosted demand for Treasuries.
FROM THE DESK
Agency CMBS — Investor spreads in our space softened as the week progressed. New-issue Fannie Mae TBA volume came in around $1.5 billion, roughly 65% above the year-to-date weekly average. Fannie spreads were flat to two bps wider, week over week. Ginnie Mae TBA volume also picked up the later part of last week, as the Treasury rally pushed the 10-year note yield from 4.40% on Monday to below 4.25% at times on Thursday and Friday—a level not seen since May 1. However, Ginnie Mae spreads followed the lead of Fannies and widened two to three bps at the end of the week, commensurate with the Treasury rally.
Municipals — AAA tax-exempt yields were lower in the front end of the curve and flat thereafter, week over week. The municipal bond calendar was heavy last week, as issuers looked to price new issues before the upcoming holiday week. The housing sector had a pickup in activity. Several short-term, cash-collateralized, Fannie Mae M-TEB and agency credit-enhanced deals also priced. Spreads were consistent to slightly tighter compared with prior weeks. Municipal bond funds had a ninth straight week of inflows, with $76 million entering (year-to-date inflows of $5.99 billion). The high-yield fund subsector had inflows of $45 million last week.
The information contained herein, including any expression of opinion, has been obtained from, or is based upon, resources believed to be reliable, but is not guaranteed as to accuracy or completeness. This is not intended to be an offer to buy or sell or a solicitation of an offer to buy or sell securities, if any referred to herein. Lument Securities, LLC may from time to time have a position in one or more of any securities mentioned herein. Lument Securities, LLC or one of its affiliates may from time to time perform investment banking or other business for any company mentioned.
